Quickstart: Mixture-Based Muscle Synergy Analysis
Yusuke Matsui
2026-08-14
Source:vignettes/quickstart.Rmd
quickstart.RmdIntroduction
This quickstart guide demonstrates the basic workflow for
mixture-based muscle synergy analysis using the synergyMixR
package. We will show a minimal example that:
- Generates synthetic EMG data using
generate_synergy_data() - Fits a Mixture Factor Analysis (MFA) model using
mfa_em_fit() - Visualizes the synergy loadings using
plot_cluster_synergy_loadings_mfa()
Step 1: Generate Synthetic Data
We start by generating synthetic EMG data with known cluster structure. This simulates a heterogeneous population where different subjects exhibit distinct muscle synergy patterns.
# Generate synthetic data
# N = 30 subjects, K = 2 clusters, r = 3 synergies, M = 8 muscles
sim_data <- generate_synergy_data(
  N = 30,           # Number of subjects
  K = 2,            # Number of clusters (subgroups)
  r = 3,            # Number of synergies per cluster
  M = 8,            # Number of muscles (EMG channels)
  T_each = 100,     # Time points per subject
  cluster_sep_spatial = 1.0,    # Spatial structure separation
  cluster_sep_temporal = 1.0,   # Temporal coordination separation
  cluster_sep_stability = 1.0,  # Stability-adaptability separation
  seed = 123        # For reproducibility
)

# Extract the data and true cluster assignments
list_of_data <- sim_data$list_of_data
z_true <- sim_data$true_cluster

# Check the structure
cat("Number of subjects:", length(list_of_data), "\n")
#> Number of subjects: 30
cat("Data dimensions for subject 1:", dim(list_of_data[[1]]), "\n")
#> Data dimensions for subject 1: 100 8
cat("True cluster assignments:", table(z_true), "\n")
#> True cluster assignments: 17 13
Step 2: Fit MFA Model
Now we fit a Mixture Factor Analysis model to identify the underlying synergy patterns and cluster structure.
# Fit MFA model with K=2 clusters and r=3 synergies
fit_mfa <- mfa_em_fit(
  list_of_data = list_of_data,
  K = 2,              # Number of clusters to fit
  r = 3,              # Number of synergies per cluster
  max_iter = 50,      # Maximum EM iterations
  nIterFA = 5,        # Sub-iterations for factor updates
  tol = 1e-3,         # Convergence tolerance
  n_init = 3,         # Number of random initializations
  use_kmeans_init = TRUE  # Use k-means for initialization
)
#> Warning: Argument 'nIterFA' is deprecated. Use 'iter_fa' instead.
#> Using OpenMP with 1 threads
#> Converged by assignment at iter=5
#> Using OpenMP with 1 threads
#> Converged by assignment at iter=5
#> Using OpenMP with 1 threads
#> Converged by assignment at iter=5
#> Using OpenMP with 1 threads
#> Converged by assignment at iter=5

# Check the results
cat("Converged log-likelihood:", fit_mfa$logLik, "\n")
#> Converged log-likelihood: 22288.88
cat("Estimated cluster assignments:", table(fit_mfa$z), "\n")
#> Estimated cluster assignments: 13 17

# Compare with true assignments (using Adjusted Rand Index)
ari <- mclust::adjustedRandIndex(fit_mfa$z, z_true)
cat("Adjusted Rand Index (clustering accuracy):", round(ari, 3), "\n")
#> Adjusted Rand Index (clustering accuracy): 1
Step 3: Visualize Synergy Loadings
Finally, we visualize the identified muscle synergy patterns for each cluster.
# Plot synergy loadings as a heatmap
plot_cluster_synergy_loadings_mfa(fit_mfa, plot_type = "heatmap")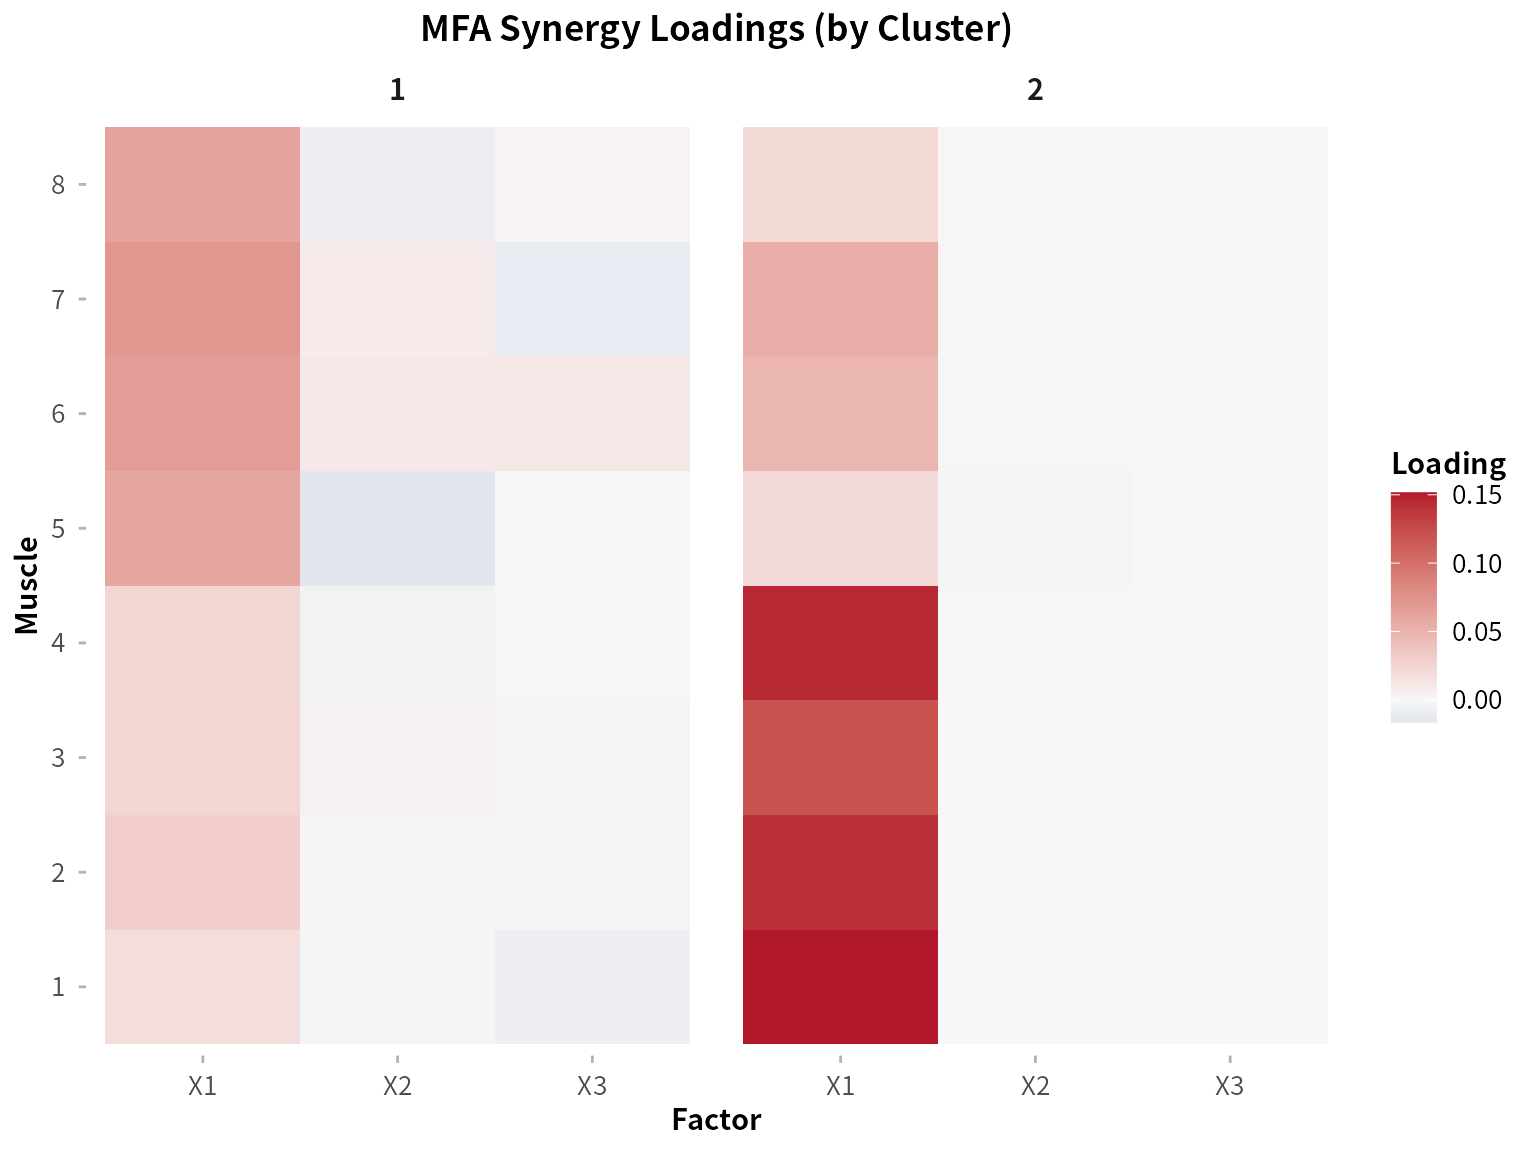
The heatmap shows the synergy loadings (Lambda matrices) for each cluster. Each row represents a muscle, and each column represents a synergy. The color intensity indicates the strength of each muscle’s contribution to each synergy.
Additional Visualizations
You can also visualize the factor scores (time-varying synergy activations):
# Compute factor scores
fit_mfa <- compute_factor_scores_mfa(fit_mfa, list_of_data)

# Plot factor scores for all subjects
plot_all_factor_scores_mfa(fit_mfa, list_of_data, overlay_subjects = TRUE)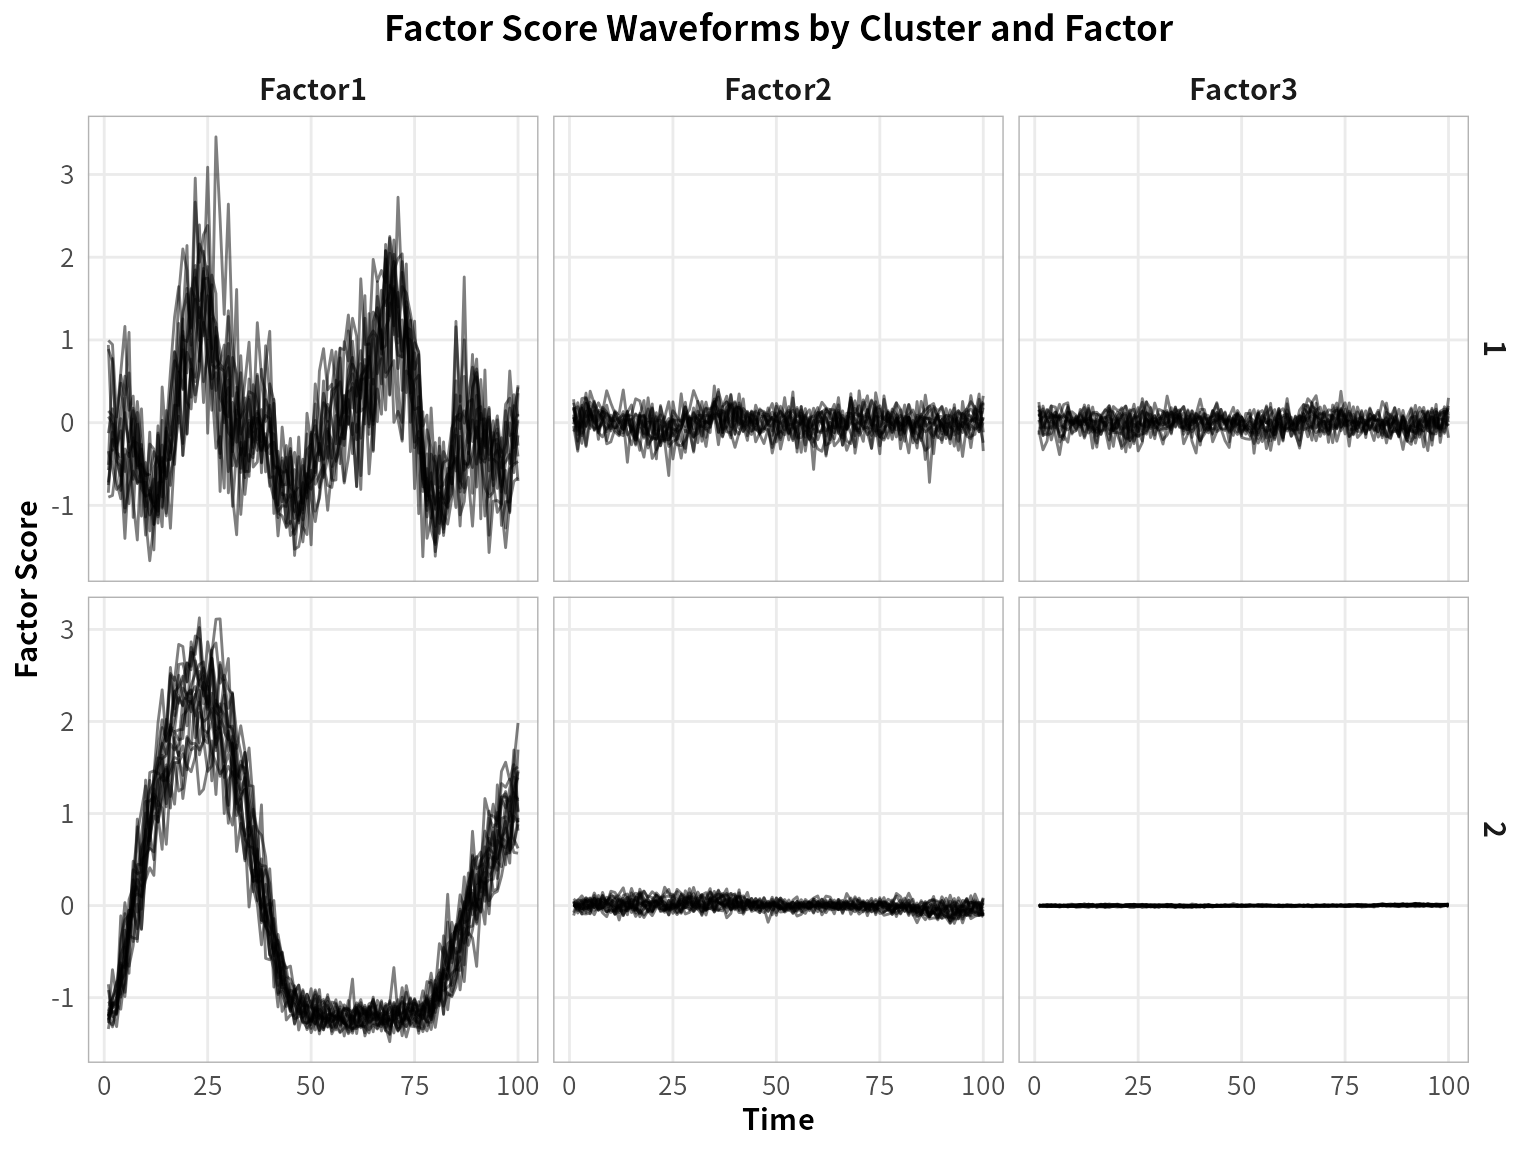
Next Steps
For more advanced usage, including:
- Automatic selection of optimal K and r using BIC
- Post-hoc rotation of synergy patterns
- Comparison between MFA and MPCA methods
- Detailed simulation studies
Please see the main tutorial vignette:
vignette("tutorial", package = "synergyMixR")Summary
This quickstart demonstrated the basic three-step workflow:
-
Generate or load data: Use
generate_synergy_data()for synthetic data or prepare your own EMG data as a list of matrices -
Fit the model: Use
mfa_em_fit()to identify clusters and synergy patterns -
Visualize results: Use
plot_cluster_synergy_loadings_mfa()and related functions to interpret the results
The mixture-based approach is particularly useful when you suspect that your population contains distinct subgroups with different synergy patterns, rather than assuming all subjects share the same underlying structure.